Friday, February 4, 2011

Even faster gene predictions

One question we sometimes get from our users is, “I have lots of gene lists. Can I do predictions with them all in one shot instead filling out the form each time?”

Query Runner is our solution to this problem. It's a scriptable command-line tool bundled with the GeneMANIA Cytoscape plugin and highly optimized to eat gene lists for breakfast.

You can choose from a bunch of different output formats for the prediction results ranging from plain gene lists with scores, to full-fledged reports packed with provenance, network adjacency lists and GO annotation statistics.

Loading up prediction networks is currently the biggest bottleneck in GeneMANIA. For example, we have about 650 MB worth of networks, compressed, in our human data set. Most of the time in the prediction process is spent loading that up. For instance, in our example human query, loading takes up 61% of the time of a single prediction:
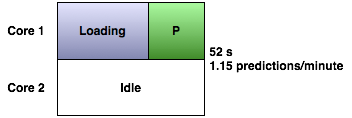
The GeneMANIA website and Cytoscape plugin get around this by loading the data once and performing multiple queries with it, one at a time:

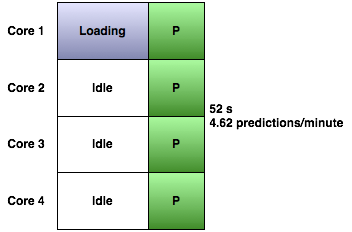
Query Runner tops this by running a query on each available core on the machine:

On a quad core processor, it takes just as long to run four predictions as it does for one:
Tutorial: Getting started with GeneMANIA


This tutorial goes over the basic interface elements of GeneMANIA. Give GeneMANIA a try after you watch the video.

I used Chrome to make the tutorial.

Tuesday, February 1, 2011

Editing colours in the GeneMANIA visualisation

We've been asked recently whether it is possible to customise the colours used in the GeneMANIA visualisation. We understand the rationale behind this request: Sometimes, it is useful to change the colours to have a better aesthetic fit with a publication.

That being said, the colours used in GeneMANIA were not chosen arbitrarily. We chose the colours of most of the networks to be strong, and we chose much lighter, less saturated colours for co-expression and co-localisation networks.

Often, edges for co-expression and co-localisation form close to the complete graph. Since this does not add much visual information, we decided to make these edges less visually prominent and not affect the layout.

In future, we may have a feature to allow the user to change the network colours. However, this will need to take into account the impact it will have on usability and layout.

In the meanwhile, you can edit the colours of the network in the PDF report with a tool like Adobe Illustrator. The next version of GeneMANIA will support exporting the network as SVG. Since SVG is an open format, it should be easier to edit.